1- Climate
1-1- Climate classification
The Nile river basin encompasses a wide range of climate types due to the large geographical extent across the African continent. Using the Köppen- Geiger classification, the climate classes in the Nile river basin are categorized into five big categories: tropical, sub- tropical, arid, semi-arid, and Mediterranean (Figure 1). The equatorial lakes and parts of Ethiopia are dominated by tropical wet and dry climates, while in Sudan and Egypt sub-tropical dry arid (desert) is the main climate. Parts of the South of Sudan are characterized by sub-tropical dry semi-arid climate. In addition, around the lake Victoria and in parts of the Ethiopian highlands, the tropical wet and tropical monsoonal climate is found (NBI, 2016).

Figure 1: Köppen-Geiger Climate Classification Map of the Nile Basin. Source: (Beck et al., 2023).
1-2-Precipitation
Precipitation patterns in the Nile Basin exhibits high spatial and temporal variations, where high rainfall rates exceeding a yearly average of 2,000 mm are found in the Equatorial lakes region and the Ethiopian highlands, while in the arid regions, annual rainfall are below 50 mm. According to Ribbe & Ahmed (2006) and Camberlin (2009) 28% of the total basin’s area receives less than 100 mm annually, and 34% receives between 700 – 1,000 mm/year.
This spatial variability is caused by the inter-tropical convergence zone (ITCZ) that is the main driver of precipitation events in the equatorial lake region and the Ethiopian highlands and where the impacts almost disappears in the north of Sudan and Egypt (Mellander et al., 2013).
The wet season in both the Atbara and Blue Nile is between May and October, where most of the precipitation falls within this period, and almost no rainfall occurs out of it (NBI, 2016).
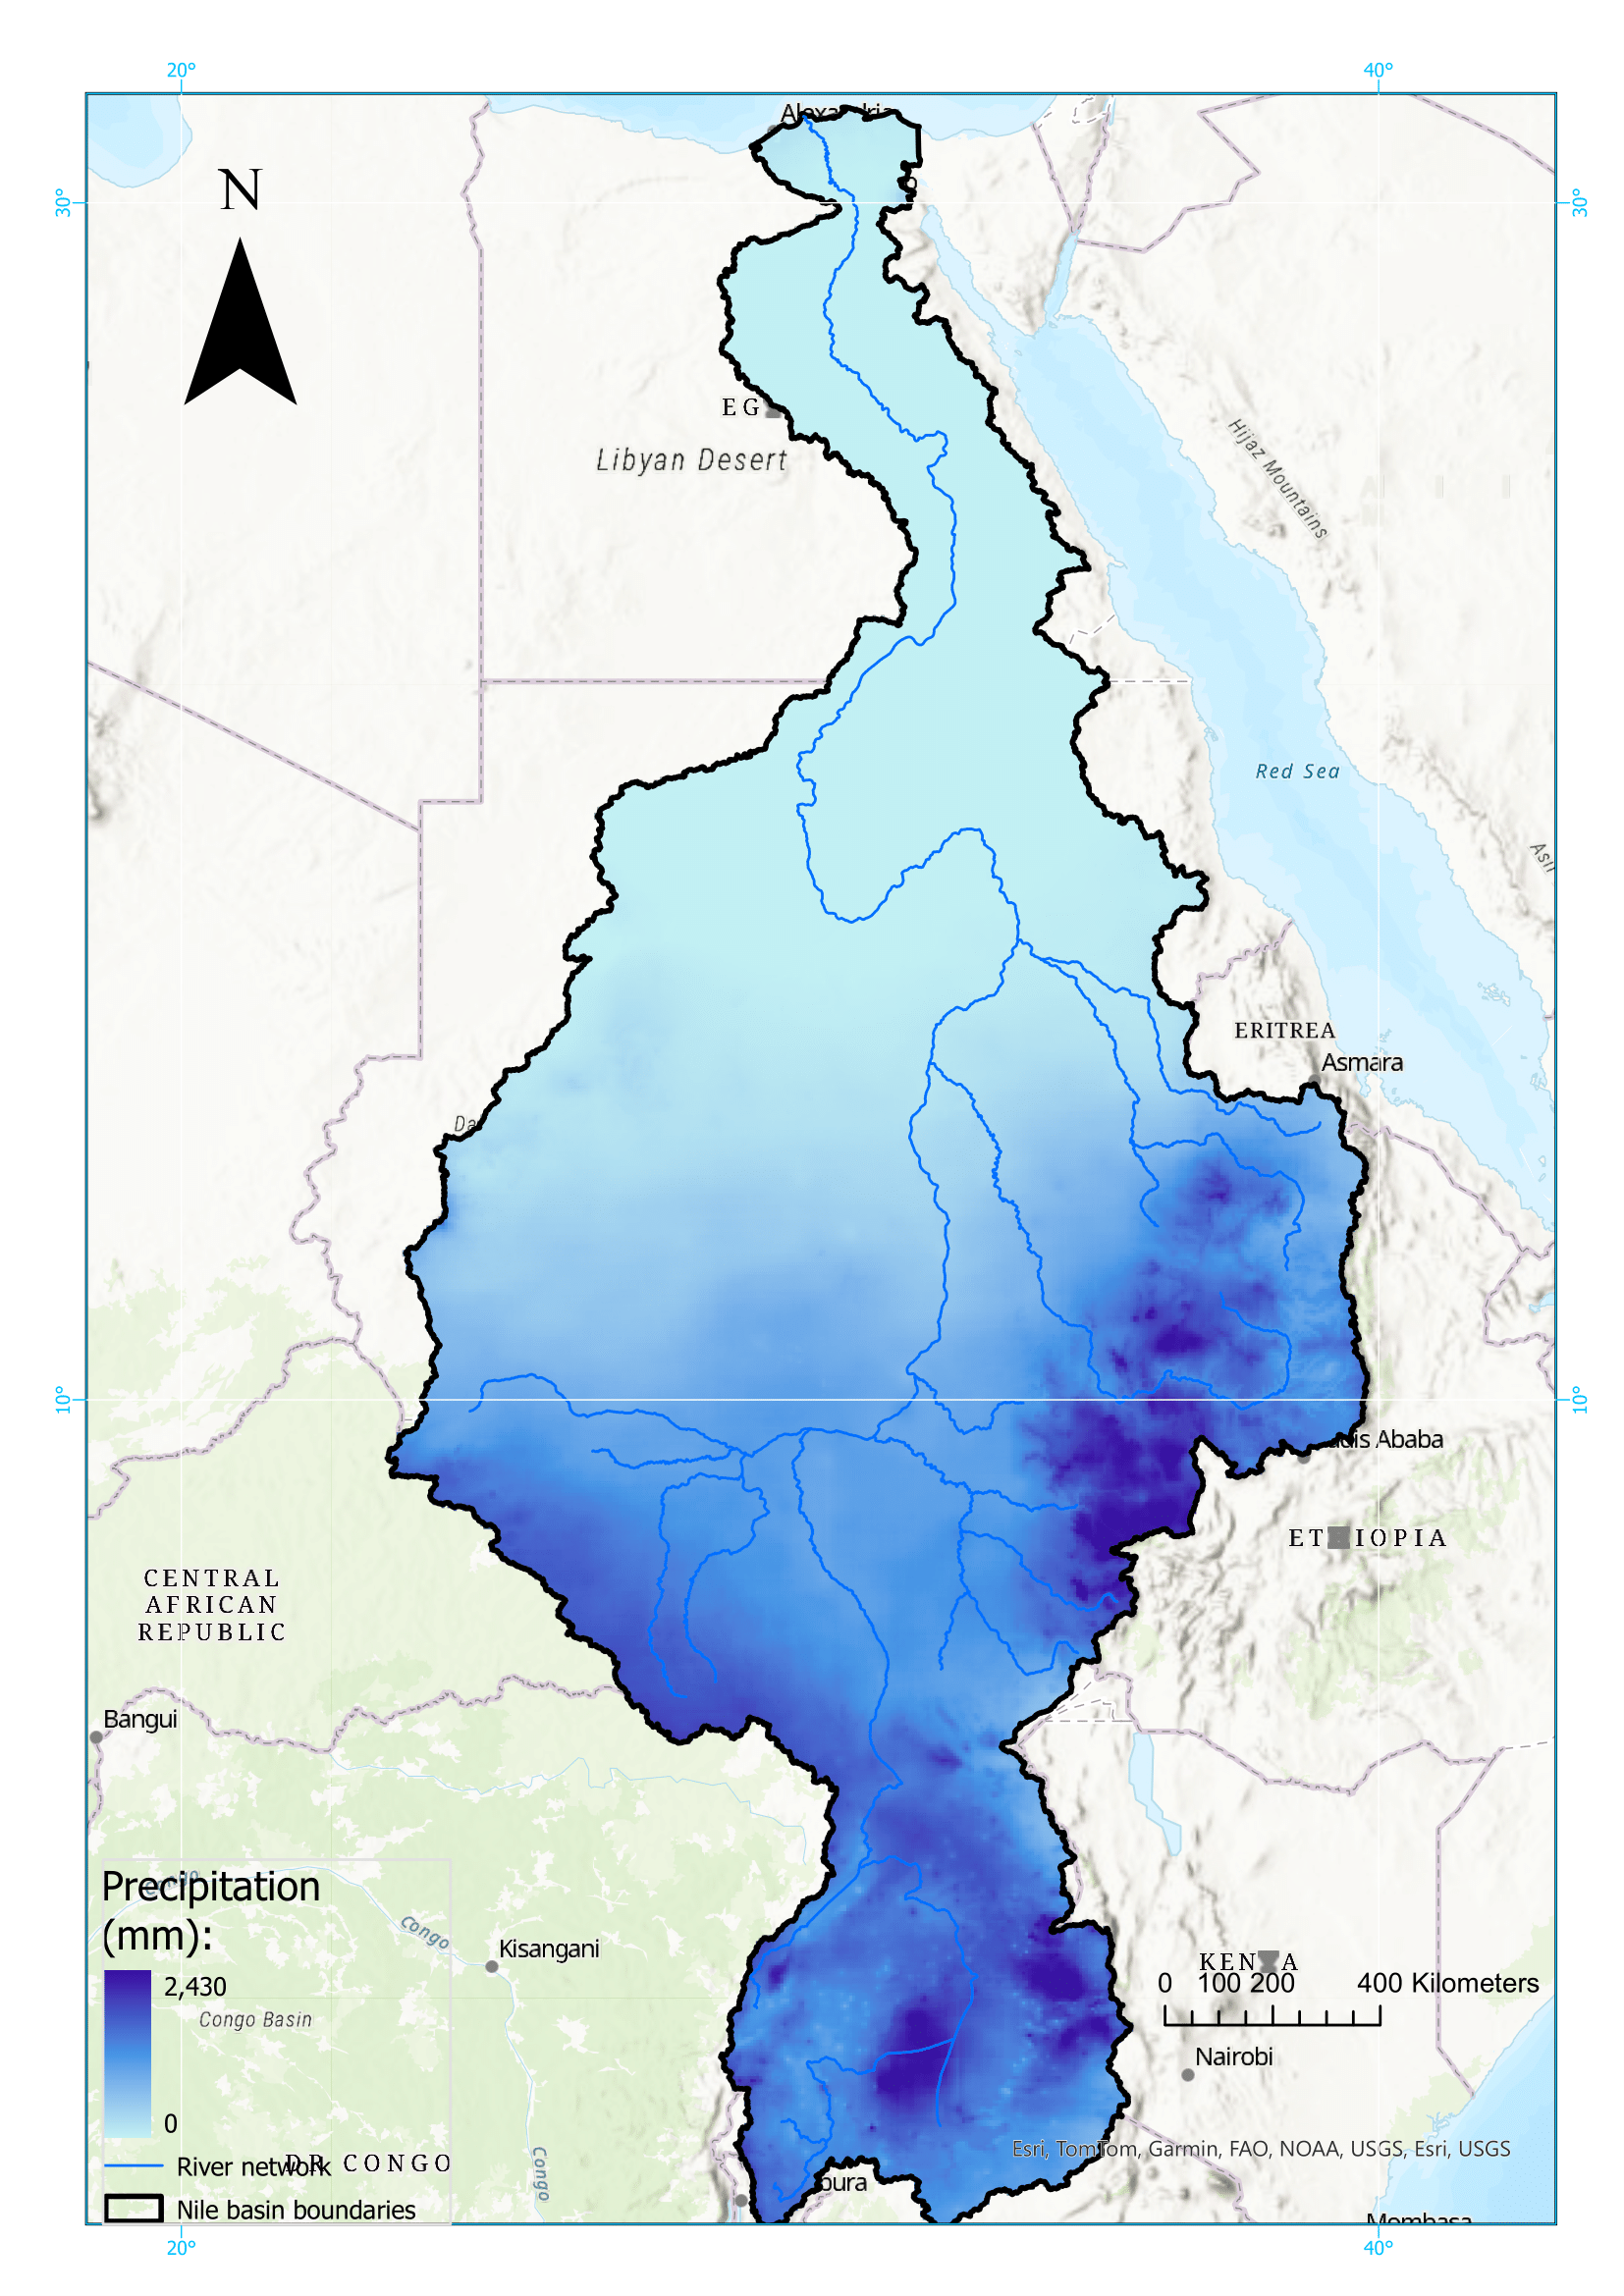
Figure 2: Spatial distribution of mean of multi annual precipitation 1981- 2024 in the Nile basin. Source: (Funk et al., 2015)
1-3- Temperature
Similar to precipitation, the air temperature also exhibits large spatial and temporal variability. Using the monthly datasets of air temperature of the ERA5Land product (Muñoz-Sabater, 2019), mean monthly values are the lowest in the Ethiopian highlands and parts of the Equatorial lake region.
The highest values are generally recorded in the southern parts of the Blue Nile, parts of White Nile and the Main Nile, and decreases near the Delta and Mediterranean see.

Figure 3: Spatial distribution of mean of multi annual temperature 1981- Feb.2025 in the Nile basin. Source: (Muñoz-Sabater, 2019)
Temperature seasonality
he analysis of monthly temperature over the Nile basin reveals distinct spatial and temporal patterns that reflects the region’s complex geography and seasonal climate change dynamics. Temporally, by looking into Figure 4, we notice that starting January, the average air temperature for the whole Nile basin increases gradually, until it reaches the peak in May, slightly above 28°C. Afterwards, a graduate decline in temperature begins with a noticeable drop between June and July. However these temporal are not applied on the whole Nile basin, where we notice, based on Figure 5, than in the southern part, near the equator, the temperature is generally stable and warm around 20°C during the whole year. While the northern part has more pronounced seasonal variability, where the hot season is between May and September, reaching values above 35°C in some areas of Sudan and Egypt.

Figure 4: Temporal distribution of mean monthly preciptation (1981 – Feb.2025).
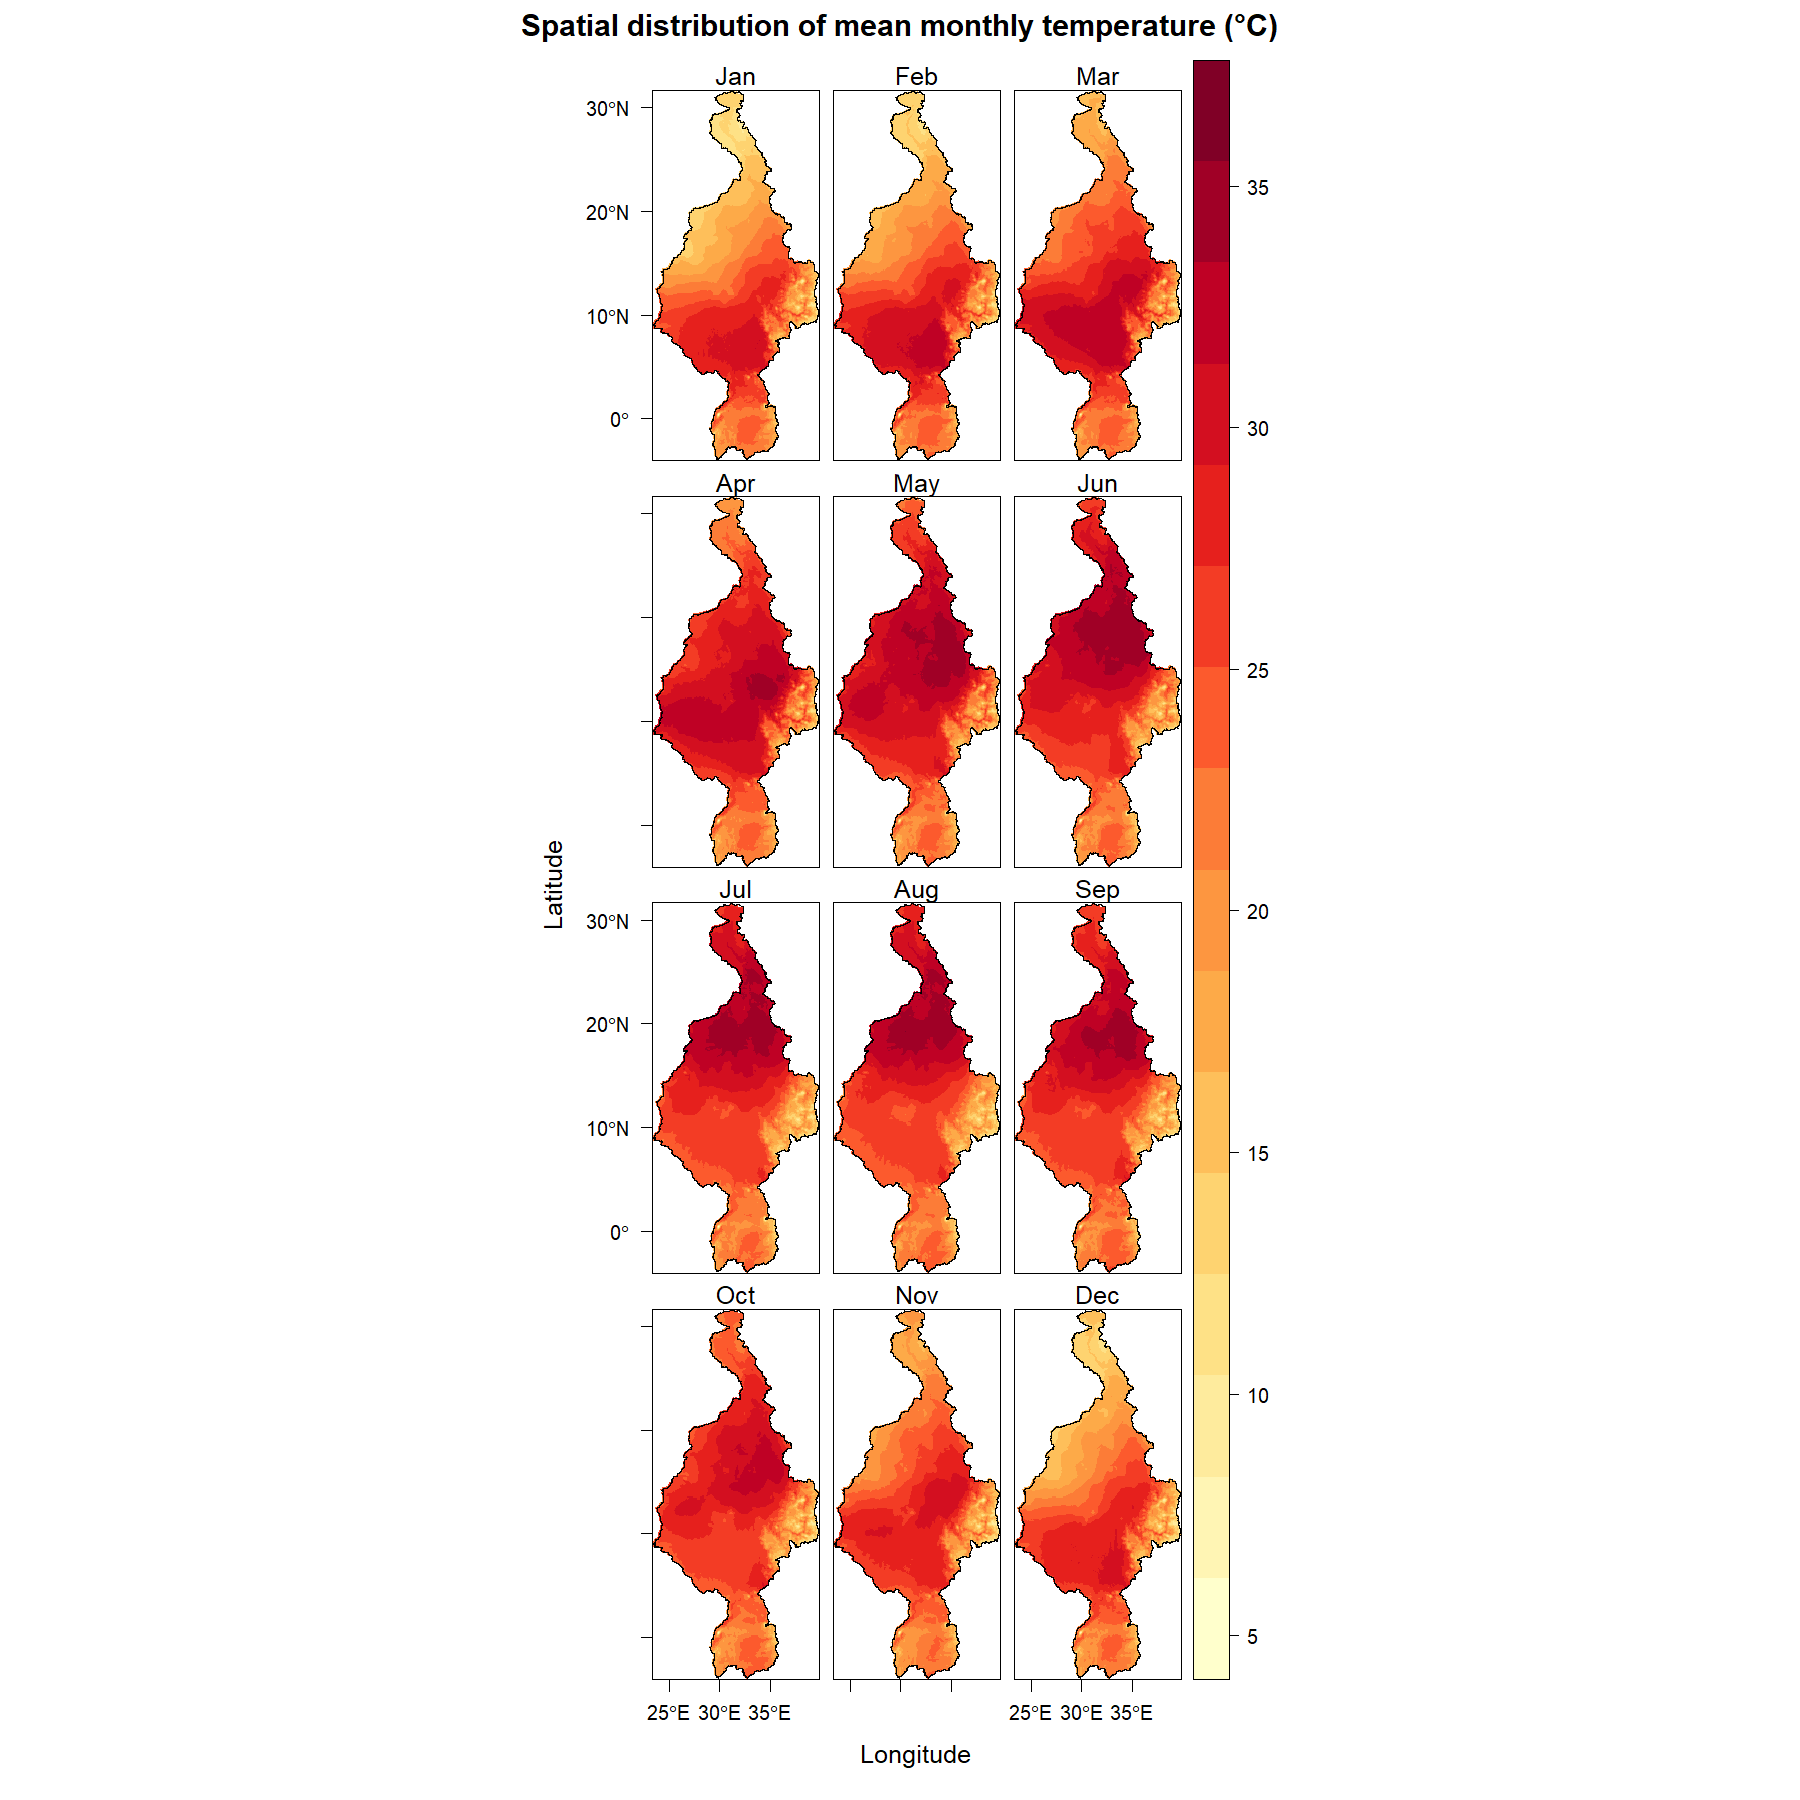
Figure 5: Spatial distribution of mean annual temperature (°C)
2- Hydrology
2-1- Hydrological features
The hydrology of the Nile Basin is notably distinct from that of other major river basins, such as the Amazon, Congo, or Mississippi. The Nile basin is the only river basin with a “South- North” flow direction linking the Equatorial Africa to the North part of the continent, representing the only remaining corridor for animals and humans in this direction (Pacini & Harper, 2016).
However, a large portion of the Nile Basin is hydrologically inactive. More than 40% of the basin receives less than 1,500 mm of rainfall per year, much of which falls within arid and hyper-arid regions. As a result, these areas contribute minimally to the Nile’s direct runoff. Moreover, around 89% of the rain falling on the Nile basin comes from outside the watershed. Therefore, changes in the rainfall patterns in the region, makes the Nile very vulnerable in terms of amount of precipitation received (Pacini & Harper, 2016).
The average discharge of the main Nile measured at Aswan is around 85Km3/year, leading to a specific discharge of 0.27m/year, which is the lowest specific discharge of any large basin (The Amazon 9.6m, The Mississippi 1.8 m, The Congo 3.2m, and the Ganges 3.8m) (Pacini & Harper, 2016). The contribution of the main tributaries is highly different. The Blue-Nile (Abbay in Ethiopia) originating in the Ethiopian highlands contributes with around 60% (or 4/7) of the total Nile runoff (Mohmed et al., 2005; Basheer et al., 2024). The White Nile originates in the Lake Victoria and contributes of around 28% (2/7) of the total discharge of the Nile basin (Mohamed et al., 2005; Senay et al., 2014). The remaining discharge comes mainly from the Atbara sub-Basin that also originates from the Ethiopian highlands (Pacini & Harper, 2016; Basheer et al., 2024).
Both the Atbara and the Blue Nile provide to the Nile during a single wet season (June-September) more than 90% of the total Nile flow (Pacini & Harper, 2016), where 80% comes solely from the Blue Nile (Basheer et al., 2024)
2-2- Water balance
Significant spatial and temporal variability in the hydrological processes characterizing the Nile Basin. Based on the data extracted from water balance app from ESRI in three different locations in the Nile basin we have:
Cairo – Egypt: Precipitation are consistently low (below 130 mm/year), evapotranspiration is also minimal (50mm/year), and the runoff remains small but fluctuating through the years indicating the high influence by upstream water flows rather than local precipitation. This situation affects high the changes in storage that proves the high reliance on upstream waters resources to maintain hydrological fluxes.

Figure 6: Temporal distribution of annual values of components of hydrological cycle in Cairo- Egypt between 2000- 2024. Source: ESRI Water Balance App
Khartoum- Sudan : with a highly fluctuating precipitation rate (between 85 – 418 mm/year) and moderate evapotranspiration rates, the runoff volume depends highly of the rainfall amount, which lead to a fluctuation in the changes of storage with negative values during dry years (e.g., 2011–2016), indicating reduced water availability.

Figure 7: Temporal distribution of annual values of components of hydrological cycle in Khartoum – Sudan between 2000- 2024. Source: ESRI Water Balance App
Bahir Dar- Ethiopia: has high precipitation rates comparing to the above mentioned locations with an average value of 1,000 mm/year, in addition to high evapotranspiration rates due to the humid climate, the proximity to lake Tana and substantial dense vegetation. These elements impacts the runoff and the change in storage that are highly variating.

Figure 8: Temporal distribution of annual values of components of hydrological cycle in Bahir Dar – Ethiopia, between 2000- 2024. Source: ESRI Water Balance App
References:
- Basheer, M., Siddig, K., & & Ringler, C. (2024). Water-energy-food planning and operations framework for river basins with a case study on the Blue Nile. Journal of Hydrology. Retrieved from https://doi.org/10.1016/j.jhydrol.2024.130801
- Beck, H., McVicar, T., Vergopolan, N., A., B., Lutsko, N., Dufour, Z., . . . van Dijk, A. a. (2023). High-resolution (1 km) Köppen-Geiger maps for 1901–2099 based on constrained CMIP6 projections. Scientific data, 10(1), 724. doi:doi:10.1038/s41597-023–02549‑6
- Camberlin, P. (2009). Nile Basin Climates. In In The Nile: origin, environments, limnology and human use (pp. 307- 333). Dordrecht: Springer Netherlands. Retrieved from http://dx.doi.org/10.1007/978-1-4020-9726-3_16
- Funk, C., Peterson, P., Landsfeld, M., Pedreros, D., Verdin, J., & Shukla, S. G. (2015). The climate hazards infrared precipitation with stations—a new environmental record for monitoring extremes. Scientific data, 2(1), 1-21. doi:doi: 10.1038/sdata.2015.66
- Mellander, P. E., Gebrehiwot, S. G., Gärdenäs, A. I., Bewket, W., & Bishop, K. (2013). Summer Rains and Dry Seasons in the Upper Blue Nile Basin: The Predictability of Half a Century of Past and Future Spatiotemporal Patterns. PloS one, 8(7), e68461. doi:https://doi.org/10.1371/journal.pone.0068461
- Mohamed, Y. A., van den Hurk, B. J., Savenije, M. H., & Bastiaanssen, M. W. (2005). Impact of the Sudd wetland on the Nile hydroclimatology. Water Resources Research, 41(8). Retrieved from https://doi.org/10.1029/2004WR003792
- Muñoz-Sabater, J. (2019). ERA5-Land monthly averaged data from 1981 to present, Copernicus Climate Change Service (C3S) Climate Data Store (CDS). doi:https://doi.org/10.24381/cds.68d2bb30
- NBI. (2016). Chapter 5- Nile Basin Climate. In N. B. (NBI), The Nile Basin Water Resources Atlas (pp. 95 – 132). Nile Basin Initiative (NBI)
- Pacini, N., & Harper, D. M. (2016). Hydrological characteristics and water resources management in the Nile Basin. Ecohydrology & Hydrobiology, 16(4), 242- 254. doi:https://doi.org/10.1016/j.ecohyd.2016.09.001
- Ribbe, L., & Ahmed, S. (2006). Transboundary Water Management in the Nile River Basin. Technology Resource Management and Development 4, 13-27.
- Senay, G. B., Velpuri, N. M., Bohms, S., & Demissie, Y. (2014). Understanding the hydrologic sources and sinks in the Nile Basin using multisource climate and remote sensing data sets. Water Resources Research, 50, 8625–8650. doi:doi:10.1002/2013WR015231